
How to Build an Analytics Dashboard on Wix Using Velo

🎯 Introduction
Tracking your business performance in real time is essential for making smart decisions. Wix website owners often rely on built-in tools, but these can be limited when you want a clear, custom view of your sales, orders, and user activity. Building a custom analytics dashboard on Wix using Velo lets you see exactly what matters most to your business, all in one place. This post guides you through creating a dashboard with dynamic charts, stat cards, and filters that update instantly.
🛠️ What You Will Build
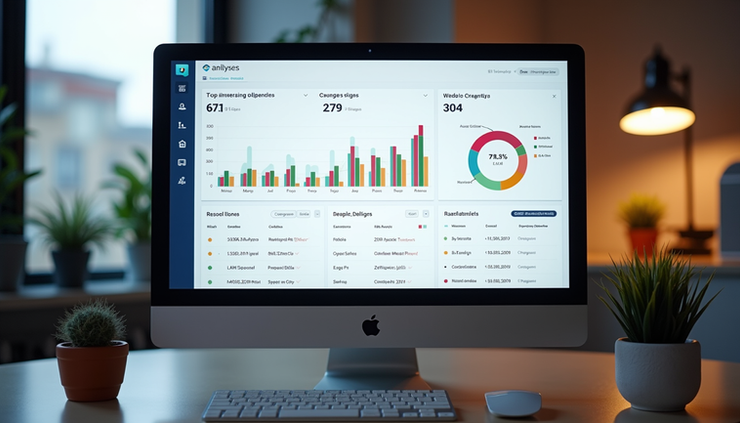
By following this tutorial, you will create a dashboard featuring:
Stat cards showing total revenue, orders, users, and conversion rate with percentage changes compared to previous periods.
A line chart displaying revenue trends over time.
A bar chart illustrating weekly sales.
A donut chart breaking down traffic sources.
A filterable transactions table showing the latest 10 orders.
A period switcher with buttons for 7 days, 30 days, 90 days, and 1 year to update all data dynamically.
This dashboard will use dark theme colors for a modern look and will be fully interactive.
✅ Prerequisites
Before you start, make sure you have:
Wix Dev Mode enabled on your site.
A Wix database collection set up to store your transaction data.
Basic knowledge of JavaScript and Wix Velo APIs.
The Chart.js library ready to load via an HTML component.
📦 Step 1 — Data Collection
Your dashboard depends on clean, structured data. Create a Wix database collection (e.g., `Transactions`) with these fields:
`amount` (Number): The transaction value.
`status` (Text): Order status like "Completed" or "Pending".
`clientName` (Text): Customer name.
`service` (Text): Service or product sold.
`date` (Date and Time): When the transaction occurred.
`source` (Text): Traffic source such as "Google", "Facebook", or "Direct".
Make sure your data is consistent and updated regularly for accurate reporting.
💻 Step 2 — Stat Cards
Stat cards provide quick insights at a glance. Use `wixData.aggregate()` to calculate:
Total revenue: Sum of `amount` for the selected period.
Total orders: Count of transactions.
Unique users: Count distinct `clientName`.
Conversion rate: Orders divided by total site visitors (if you track visitors).
To show percentage change compared to the previous period:
Query the current period data.
Query the previous period data.
Calculate the difference and display it with an arrow or color indicator.
Example snippet for revenue aggregation:
```javascript
import wixData from 'wix-data';
async function getRevenue(startDate, endDate) {
const result = await wixData.aggregate("Transactions")
.between("date", startDate, endDate)
.sum("amount")
.run();
return result.items[0].sum.amount || 0;
}
```
Update your stat cards dynamically when the period switcher changes.
📊 Step 3 — Charts
Charts bring your data to life. Use Chart.js loaded inside an HTML component on your Wix page.
Line chart for revenue trends over time.
Bar chart for weekly sales totals.
Donut chart for traffic source distribution.
Use a dark theme color palette for better visual appeal and readability.
Example of loading Chart.js in an HTML component:
```html
<script src="https://cdn.jsdelivr.net/npm/chart.js"></script>
<canvas id="revenueChart"></canvas>
<script>
const ctx = document.getElementById('revenueChart').getContext('2d');
const revenueChart = new Chart(ctx, {
type: 'line',
data: {
labels: [...], // Dates
datasets: [{
label: 'Revenue',
data: [...], // Revenue values
borderColor: '#4caf50',
backgroundColor: 'rgba(76, 175, 80, 0.2)'
}]
},
options: {
scales: {
y: { beginAtZero: true }
},
plugins: {
legend: { labels: { color: '#fff' } }
}
}
});
</script>
```
Pass data from your Wix page code to the HTML component using postMessage or dataset attributes.
📋 Step 4 — Data Table
Show the latest 10 transactions in a table with search and filter options.
Use `wixData.query()` to fetch transactions sorted by date descending.
Add a search box to filter by `clientName` or `service`.
Add a status filter dropdown to show only "Completed", "Pending", or all orders.
Example query with filters:
```javascript
let query = wixData.query("Transactions").descending("date").limit(10);
if (searchTerm) {
query = query.contains("clientName", searchTerm);
}
if (statusFilter && statusFilter !== "All") {
query = query.eq("status", statusFilter);
}
const results = await query.find();
$w("#transactionsTable").rows = results.items;
```
Update the table dynamically when filters change.
🔄 Step 5 — Period Switcher
Add buttons for 7D, 30D, 90D, and 1Y periods.
When a button is clicked, calculate the start date based on the current date.
Re-run all queries for stat cards, charts, and tables with the new date range.
Update the UI to highlight the active period.
Example:
```javascript
$w("#btn7D").onClick(() => updateDashboard(7));
$w("#btn30D").onClick(() => updateDashboard(30));
function updateDashboard(days) {
const endDate = new Date();
const startDate = new Date();
startDate.setDate(endDate.getDate() - days);
// Refresh data queries and UI updates here
}
```
This makes your dashboard interactive and responsive to user needs.
🐛 Common Issues — 4 Row Table
Charts not showing: Ensure Chart.js loads before drawing charts.
Data not updating: Verify query field names match your collection exactly.
Slow loading: Add `.limit(50)` to queries to reduce data load.
Filter broken: Use correct `wixData.filter` operators like `.eq()`, `.contains()`.
Debugging these common problems will save time and improve your dashboard’s reliability.
💡 Pro Tips
Cache results for repeated queries to improve performance.
Add a loading skeleton or spinner while data loads.
Include an export to CSV button so users can download transaction data.
Use consistent date formats across queries and UI.
Test your dashboard on different devices to ensure responsiveness.
🚀 Conclusion
Building a custom analytics dashboard on Wix with Velo and Chart.js gives you powerful insights tailored to your business. You can track revenue, orders, users, and traffic sources all in one place with interactive charts and filters. This setup helps you make data-driven decisions faster.
If you want expert help building or customizing your Wix dashboard, visit wixcrafters.com or email wixcrafters@gmail.com. Our team has a 5-star rating on Fiverr and specializes in Wix Velo development.
Start building your dashboard today and turn your Wix site into a smart business tool.


Comments